Plotting Stellar RVs using the TSDB
The TSDB is a convenient way to visualize the RVs and other observational data. This tutorial demonstrates some methods for doing so.
[1]:
from datetime import datetime
from modules.quicklook.src.analyze_time_series import AnalyzeTimeSeries
%matplotlib inline
The line below loads the TSDB and exposes the plotting method AnalyzeTimeSeries.plot_observing_rv_time_series(). This example uses a Postgres implementation of the TSDB. Some users will instead use the SQLite version and use a command like myTS = AnalyzeTimeSeries(backend='sqlite', db_path='kpf_ts.db').
[2]:
myTS = AnalyzeTimeSeries(backend='psql')
INFO: Starting AnalyzeTimeSeries
INFO: Starting KPF_TSDB
INFO: Jupyter Notebook environment detected.
INFO: Base data directory: /data/L0
INFO: Backend: psql
INFO: Table prefix: tsdb_
INFO: PSQL server: 127.0.0.1
INFO: PSQL username: timeseriesdba
INFO: PSQL user role: admin
INFO: Metadata table exists.
INFO: Metadata table read.
INFO: Data tables exist.
To plot the RVs from one night for a particular target, use a command like the one below.
[3]:
starname = '191939'
UT_date = datetime(2023,7,28)
myTS.plot_observing_rv_time_series(starname=starname,
                                   start_date=UT_date,
                                   panels=['rv', 'snr', 'seeing', 'guiding', 'el', 'sun', 'moon'],
                                   annotate = ['rv_rms'],
                                   show_plot=True,
                                   fig_path=None)
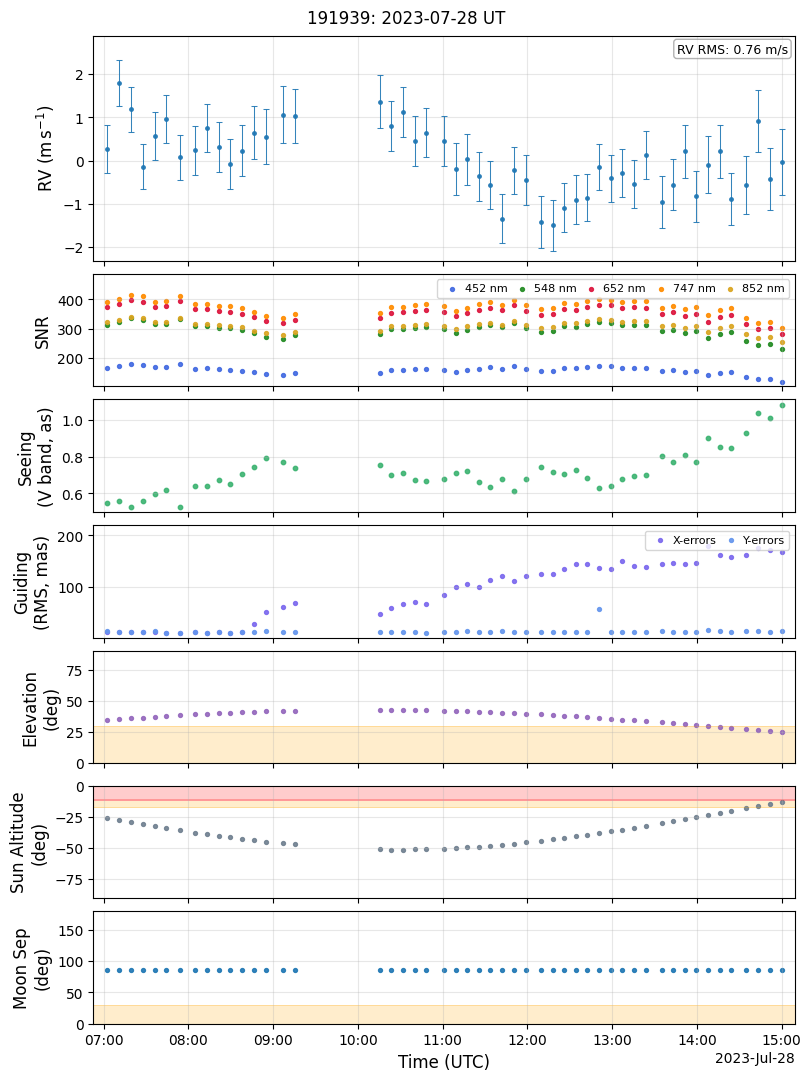
Note that the panels can be selected and reordered using the panels keyword. If panels isn’t specified, only the RV panel is shown. The “RV RMS” keyword is controlled by the keyword annotate = ['rv_rms'].
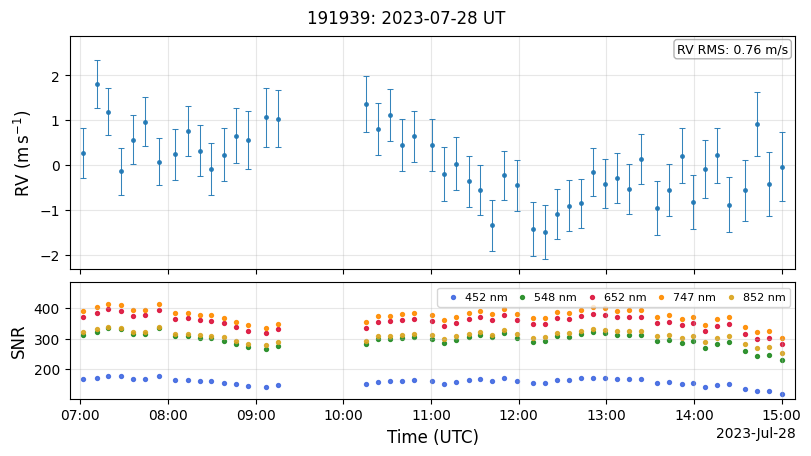
[4]:
starname = '191939'
UT_date = datetime(2023,7,28)
myTS.plot_observing_rv_time_series(starname=starname,
                                   start_date=UT_date,
                                   panels=['rv', 'snr'],
                                   annotate = ['rv_rms'],
                                   show_plot=True,
                                   fig_path=None)
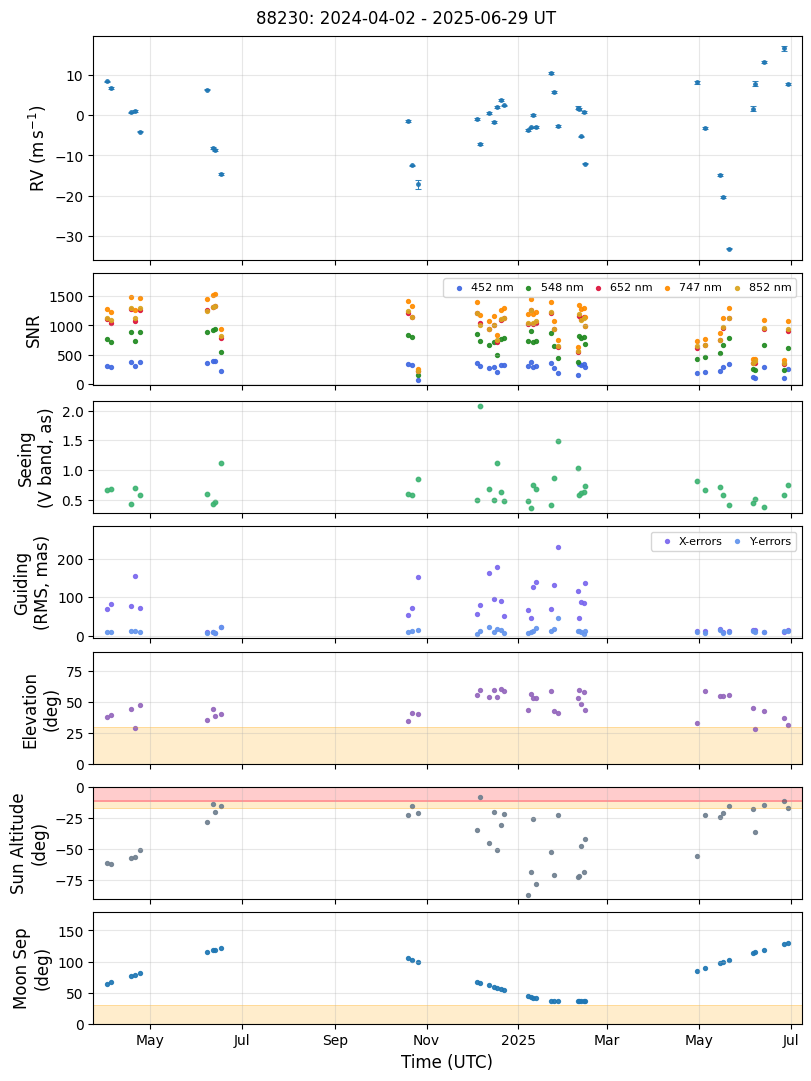
The method can also be applied to time periods longer than one night (start_date and end_date are both specified).
[5]:
starname = '88230'
start_date = datetime(2024,1,1)
end_date = datetime(2026,1,1)
myTS.plot_observing_rv_time_series(starname=starname,
                                   start_date=start_date,
                                   end_date=end_date,
                                   panels=['rv', 'snr', 'seeing', 'guiding', 'el', 'sun', 'moon'],
                                   show_plot=True,
                                   fig_path=None)